
 Translate
Offshore Water Quality
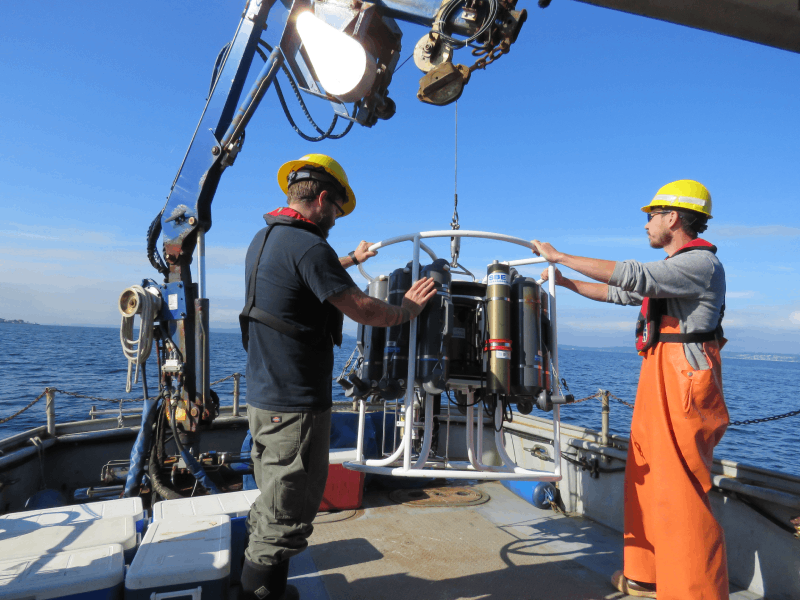
King County’s marine environment supports a rich ecosystem that ranges from microscopic plankton to iconic orcas. These creatures depend on an ecological balance that is threatened by environmental challenges like pollution, habitat degradation, and climate change. To better understand and safeguard the health of Puget Sound, King County monitors offshore waters by conducting laboratory analysis of water quality. We look at parameters such as bacteria and nutrients and take physical, chemical, and biological measurements with a multi-sensor device called a CTD (conductivity, temperature, and depth) at 14 offshore locations in the Central Basin and 4 locations in the marine water-influenced area of the Duwamish River. These locations include sampling near wastewater outfalls as well as sampling located further away from outfalls. We collect these samples twice monthly during most of the year (monthly in December and January).
The laboratory and CTD data we collect offer insights into Puget Sound’s ecosystems, such as the distribution of nutrients and amount of dissolved oxygen in the water, the influence of regional climate and freshwater input on water properties, and the influence of incoming water from the Pacific Ocean. These data allow scientists to track changes and make informed decisions for ecosystem management and conservation.
More Information
The goals of this monitoring are to:
-
Collect and maintain a long-term dataset of conditions within Puget Sound’s Central Basin.
-
Characterize water quality within King County’s marine ecosystem.
-
Evaluate spatial and seasonal variation of water quality parameters from year-to-year.
-
Determine physical, chemical, and biological dynamics that influence water quality.
-
Assess long-term trends in water quality parameters.
-
Monitor water quality near King County marine wastewater outfalls.
-
Support regional marine monitoring and modeling efforts.
-
Evaluate data with regard to Washington State water quality guidelines.
| Parameter | Sensor | Reporting units | Detection Limit |
|---|---|---|---|
| Chlorophyll | WET Labs WETStar Fluorometer | µg/L | 0.06 |
| Conductivity | Seabird SBE 4 Conductivity Sensor | S/m | -- |
| Depth | Seabird SBE 29 Pressure Sensor | m | -- |
| Dissolved Oxygen | Seabird SBE 43 Dissolved Oxygen Sensor | mg/L | 0.5 |
| Density | Calculated from conductivity, temperature, and depth sensors | kg/m3 | -- |
| Sigma-Theta Density | Potential density (minus 1000) from conductivity, temperature, and depth | kg/m3 | -- |
| Light Transmission | WET Labs C-Star Transmissometer | % Light | 0.01 |
| PAR (Surface) | LI-COR Surface Light Intensity (PAR) LI-190-SA-50 | µmol.sm3 | -- |
| PAR (Water Column) | LI-COR Light Intensity (PAR) LI-193-SA-50 | µmol.sm3 | -- |
| Salinity | Calculated from conductivity and temperature sensors | PSS | -- |
| Temperature | Seabird SBE 3 Temperature Sensor | °C | -- |
| Nitrite + Nitrate | Seabird SUNA Nitrate Sensor (10 mm pathlength) | mgN/L | 0.034 |
| Parameter | Units | Method Detection Limit | Reporting Detection Limit | Method |
|---|---|---|---|---|
| Ammonia Nitrogen | mg/L | 0.002 | 0.01 | KEROUEL & AMINOT 1997 |
| Chlorophyll a | ug/L | 0.05 | 0.1 | EPA 445.0 |
| Enterococcus | CFU/100ml | 1 | SM 9230C2A+B 23RD | |
| Fecal Coliform | CFU/100ml | SM 9222D 23RD | ||
| Nitrite + Nitrate Nitrogen | mg/L | 0.01 | 0.04 | SM4500-NO3-F |
| Orthophosphate Phosphorus | mg/L | 0.005 | 0.01 | SM4500-P-F S |
| Pheophytin a | ug/L | 2.3 | 4.66 | EPA445.0 |
| Secchi Transparency | m | |||
| Silica | mg/L | 0.05 | 0.1 | WHITLEDGE 1981 |
| Total Suspended Solids | mg/L | 0.5 | 10 | SM2540-D |
| Total Nitrogen | mg/L | 0.05 | 0.1 | SM4500-N-C S |
| Dissolved Oxygen | mg/L | 0.1 | 0.5 | SM4500-O-C |
| Salinity | PSS | 2 | 3 | SM2520-B |
Download Data
Note: some data may be provisional. Contact MarineWQ@kingcounty.gov for information about the most recent quality control of data.
Documentation
Learn more about our program by reading documents such as the latest sampling and analysis plan and read relevant reports and presentations.
Contact us with any questions or access additional resources in the Science Section Library.