
 Translate
Whidbey Basin Offshore
King County monitors water quality in Whidbey Basin to get a more complete picture of current conditions and how the marine environment is changing over time in Puget Sound. We are particularly interested in understanding short- and long-term nutrient impacts in shallow bays.
Puget Sound is a large estuary, with salt water from the Pacific Ocean and fresh water from rivers. There are many different areas (known as “basins”) within Puget Sound that are partially separated by geographic features like narrow inlets or underwater ridges (sills). Even though these basins are often considered to be separate, they are connected by the flow of water. At King County, we are interested in water quality throughout Puget Sound. We know that what is happening in King County marine waters affects waters elsewhere, and vice versa.
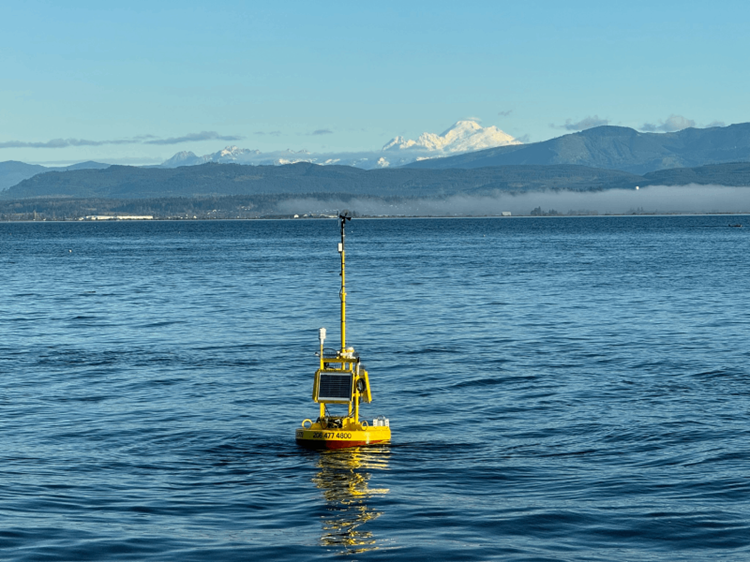
King County monitors water quality at 10 sites in Whidbey Basin by boat (east of Whidbey Island) with once- to twice-monthly conductivity-temperature-depth (CTD) profile sampling. Bottle samples are collected at five of those sites and taken back to the King County Environmental Lab for analysis. In addition to sampling by boat, three sites also have autonomous moored sensors that collect data every 15 minutes.
The data we collect in Whidbey Basin are similar to the data we collect in the Central Basin. We measure many of the same parameters, such as temperature, salinity, dissolved oxygen, and nitrate as well as phytoplankton.
More Information
The goals of this monitoring are to:
- Characterize current water quality conditions in Whidbey Basin.
- Evaluate water quality changes over days, seasons, and years.
- Understand impacts of climate (e.g., high river flows or hot summers).
- Identify links between physical, biological, and chemical components.
- Compare data to output from regional models.
Laboratory Samples
| Parameter Type | Parameter | Method* | Detection Limit |
|---|---|---|---|
| Nutrients | Ammonia Nitrogen | Kerouel & Aminot 1997 | 0.005 mg/L |
| Nitrite/Nitrate Nitrogen | SM4500-NO3-F | 0.01 mg/L | |
| Total Kjeldahl Nitrogen | EPA 351.2 | 0.1 mg/L | |
| Orthophosphate Phosphorus | |||
| Silica | Whitledge 1981 | 0.05 mg/L | |
| Pigments | Chlorophyll-a | EPA 445.0 | 0.05 µg/L |
| Pheophytin-a | EPA 445.0 | 0.1 µg/L | |
| Physicals | Dissolved Oxygen | SM4500-O-C | 0.1 mg/L |
| Salinity | SM2520-B | 2 PSS | |
| Total Suspended Solids | SM2540-D | 0.5 mg/L |
CTD Samples
| Parameter | Sensor | Units | Detection Limit |
|---|---|---|---|
| Chlorophyll | WET Labs WETStar Fluorometer | µg/L | 0.06 |
| Conductivity | Seabird SBE 4 Conductivity Sensor | S/m | |
| Depth | Seabird SBE 29 Pressure Sensor | m | |
| Dissolved Oxygen | Seabird SBE 43 Dissolved Oxygen Sensor | mg/L | 0.5 |
| Density | Calculated from conductivity, temperature, depth | kg/m3 | |
| Sigma-Theta-Density | Calculated from conductivity, temperature, depth | kg/m3 | |
| Light Transmission | WET Labs C-Star Transmissometer | % light | 0.01 |
| PAR (Surface) | LI-COR Surface Light Intensity (PAR) LI-190-SA-50 | µmol/s/m2 | |
| PAR (Water Column) | LI-COR Light Intensity (PAR) LI-193-SA-50 | µmol/s/m2 | |
| Salinity | Calculated from conductivity, temperature | PSU | |
| Temperature | Seabird SBE 3 Temperature Sensor | °C | |
| Nitrate + Nitrite | Seabird SUNA Nitrate Sensor (10 mm pathlength) | mg N/L | 0.034 |
Moorings
| Parameter | Sensor | Units | Range | Resolution | Accuracy |
|---|---|---|---|---|---|
| Depth | Seabird HydroCAT-EP | m | 0 to 100 | 0.002 | ± 0.1 |
| Temperature | Seabird HydroCAT-EP | °C | -5 to 45 | 0.0001 | ± 0.002 |
| Conductivity | Seabird HydroCAT-EP | mS/cm | 0 to 70 | 0.001 | ± 0.003 |
| Salinity | Calculated from conductivity, temperature | PSU | 0 to 42 | 0.001 | ± 0.005 |
| Dissolved Oxygen | Seabird HydroCAT-EP | mg/L | 0 to 25 | 0.007 | ± 0.1 mg/L or ± 2%, whichever is greater |
| Turbidity | Seabird HydroCAT-EP | NTU | 0 to 3000 | 0.06 to 0.17 | ± 1% |
| pH | Seabird HydroCAT-EP | 0 to 14 | 0.01 | ± 0.1 | |
| Chlorophyll | Seabird HydroCAT-EP | µg/L | 0 to 400 | 0.007 to 0.037 | ± 3% |
| Nitrate + Nitrite | Seabird SUNA Nitrate Sensor | mg N/L | 0.007 to 56 | 0.01 | ± 0.028 mg N/L or ± 10% |
| Wind Direction | ° | 0 to 360 | 1 | ± 3 | |
| Wind Speed | Vaisala | m/s | 0 to 60 | 0.1 | ± 0.3 or ± 3% |
| Air Temperature | °F | -60 to 140 | 0.1 | ± 0.3 | |
| Air Pressure |
in Hg | 17.7 to 32.5 | 0.01 | ± 0.015 | |
| Relative Humidity | % | 0 to 100 | 0.1 | ± 5% | |
| PAR (Surface) | µmol/s/m2 | 1 | ± 5% |
Whidbey CTD Dashboard
Download Data
Download the Whidbey bottle bata, Whidbey CTD data, Coupeville Wharf mooring data, Port Susan mooring data, Penn Cove surface data, or Penn Cove bottom data.
Note: some data may be provisional. Contact MarineWQ@kingcounty.gov for information about the most recent quality control of data.
Documentation
Learn more about our program by reading relevant reports and presentations.
Contact us with any questions or access additional resources in the Science Section Library.