
 Translate
Marine Moorings
Marine moorings continuously measure data in a single location, providing updated water quality data every 15 minutes. This automated sampling fills in gaps between our offshore monitoring program’s sampling events and provides real-time updates on current conditions. Moorings provide a robust data record that allows scientists to track how water quality parameters are changing over short and long time scales, from hour-by-hour to year-by-year, with minimal effort from field scientists.
King County currently maintains four active moorings in Puget Sound’s Central Basin. In November 2007, we partnered with the Seattle Aquarium to deploy its first automated water quality data collection system in Elliott Bay. Three additional systems are currently deployed: a piling-mounted system at Dockton Park in outer Quartermaster Harbor (Vashon Island), a dock-mounted system at the Yacht Club in inner Quartermaster Harbor, and a buoy-mounted system off Point Williams in Central Puget Sound.
More Information
The goals of this monitoring are to:
-
Collect and maintain a long-term dataset of conditions within Puget Sound’s Central Basin.
-
Characterize water quality within King County’s marine ecosystem.
-
Evaluate spatial and seasonal variation of water quality parameters from year-to-year.
-
Determine physical, chemical, and biological dynamics that influence water quality.
-
Assess long-term trends in water quality parameters.
-
Monitor water quality near King County marine wastewater outfalls.
-
Support regional marine monitoring and modeling efforts.
-
Evaluate data with regard to Washington State water quality guidelines.
Seattle Aquarium (Elliott Bay)
- 2x Sea-Bird HydroCAT-EP datasondes
The Elliott Bay mooring system is located at, and is a joint project with, the Seattle Aquarium. The mooring system is comprised of two sonde/sensor arrays that are deployed from the Aquarium’s pump house at the end of Pier 59. A weighted-pulley system allows the two data sondes to be deployed at fixed depths – approximately one meter and ten meters below the surface. Prior to March 14, 2019, the meteorological system was located on the roof of the pump house. Prior to September 27, 2017, two YSI 6600 V2 sondes were deployed at this site.
Dockton Park (Outer Quartermaster Harbor)
- Sea-Bird HydroCAT-EP datasonde
- Meteorological station
The outer Quartermaster Harbor mooring system is located in Dockton Park. It’s deployed as a fixed, piling-mounted system, one meter above the bottom on the outermost pier at the Dockton Park marina. As a fixed system, the total water depth, at any given time, fluctuates with the tidal cycle. The sonde is deployed at depths that generally range between 4.5 and 8.5 meters below the surface. The meteorological system is located at the top of one of the pier’s pilings. Prior to December 13, 2017, a YSI 6600 V2 sonde was deployed at this site.
Quartermaster Yacht Club (Inner Quartermaster Harbor)
- Sea-Bird HydroCAT-EP datasonde
The inner Quartermaster Harbor mooring system is located at the Quartermaster Yacht Club. The system is located on a floating dock and collects data at a fixed depth of approximately 1 m below the surface. Prior to February 2, 2017, a YSI 6600 V2 datasonde was deployed at this site.
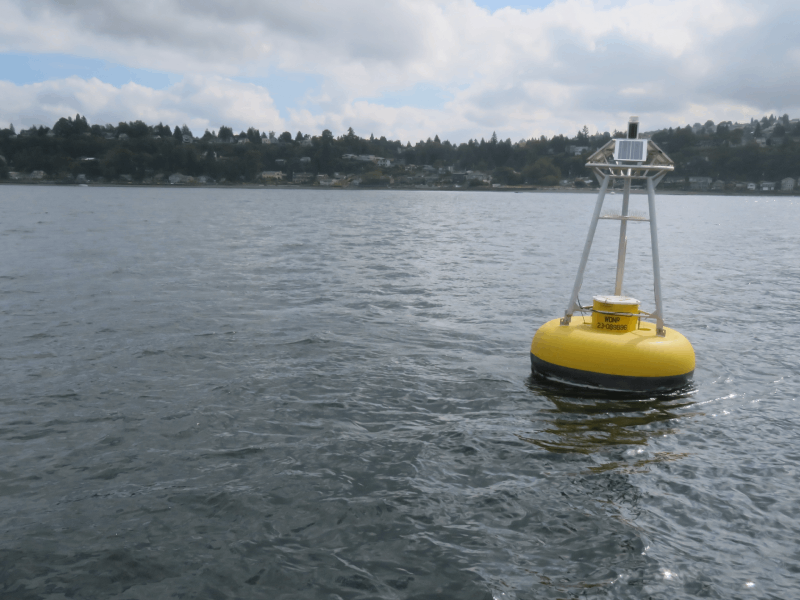
Point Williams Buoy (Central Puget Sound)
- Sea-Bird HydroCAT-EP datasonde
- SUNA nitrate sensor
- Meteorological station
The mooring system located in Central Puget Sound off of Point Williams is deployed from an oceanic buoy. The mooring system, which includes a HC-EP datasonde and SUNA sensor, is deployed 1 meter below the surface. Beginning in March 14, 2019, a Vaisala meteorological system was installed on the buoy, with a RM Young wind monitor HD for wind direction and speed. Prior to February 15, 2017, a YSI 6600 V2 datasonde was deployed at this site.
| Sensor | Range | Resolution | Accuracy | Mooring |
|---|---|---|---|---|
| HC-EP Temperature (°C) | -5 to 45 | 0.0001 | ± 0.002 | All |
| HC-EP Conductivity (mS/cm) | 0 to 70 | 0.001 | 0.003 | All |
| HC-EP Salinity (psu) | 0 to 42 | 0.001 | 0.005 psu | All |
| HC-EP Dissolved Oxygen (mg/L) | 0 to 25 | 0.007 | ± 0.1 mg/L or 2%, whichever is greater | All |
| HC-EP Turbidity (NTU) | 0 to 3,000 | 0.06 - 0.17 | ±1% | All |
| Sonde pH (HC-EP) | 0 to 14 | 0.01 | ± 0.1 | All |
| HC-EP Chlorophyll (µg/L) | 0 to 400 | 0.007 -0.037 | ±3% | All |
| pH (SeaFET, recalculated, total scale) | 6.5 to 9.0 | 0.004 | ± 0.02 | Point Williams, Quartermaster Harbor Yacht Club |
| pH initial (not recalculated) | 6.5 to 9.0 | 0.0001 | Requires validation | Point Williams, Quartermaster Harbor Yacht Club |
| Nitrite+Nitrate-Nitrogen (mg/L) | 0.007 to 56 | 0.01 | ± 0.028 or 10% | Point Williams |
| Wind Direction (degrees) | 0 to 360 | 1 | ± 3° | Point Williams, Dockton |
| Vaisala Wind Speed (m/sec) | 0 to 60 | 0.1 | ± 0.3 or ± 3% | Point Williams, Dockton |
| RM Young HD Wind Speed (m/sec) | 0 to 100 | 0.1 | ± 0.3 or ± 1% | Point Williams, Dockton |
| Air Temperature (°F) | -60 to 140 | 0.1 | ± 0.3 | Point Williams, Dockton |
| Pressure (in Hg) | 17.7 to 32.5 | 0.01 | ± 0.015 | Point Williams, Dockton |
| Relative Humidity (%) | 0 to 100 | 0.1 | ± 5% | Point Williams, Dockton |
| Rain Fall (in) | NA | 0.001 | ± 5% | Point Williams, Dockton |
| Photosynthetically Active Radiation (µmol/s/sq meter) | NA | 1 | ± 5% | Point Williams, Dockton |
Obsolete Sensors
| Sensor | Range | Resolution | Accuracy |
|---|---|---|---|
| YSI Depth (m) | 0 to 61 | 0.001 | ± 0.12 |
| YSI Temperature (°C) | -5 to 50 | 0.01 | ± 0.15 |
| YSI Conductivity (mS/cm) | 0 to 100 | 0.001 to 0.1 | ± 0.5% of reading |
| YSI Salinity (psu) | 0 to 42 | 0.01 | 0.1 psu or 1%, whichever is greater |
| YSI Dissolved Oxygen (mg/L) | 0 to 50 | 0.01 | ± 0.1 mg/L or 1%, whichever is greater |
| YSI Turbidity (NTU) | 0 to 1,000 | 0.1 | 0.3 NTU or 2%, whichever is greater |
| YSI Chlorophyll (µg/L) | 0 to 400 | 0.1 | ~0.1 µg/L detection limit |
| Sonde pH (YSI) | 0 to 14 | 0.01 | ± 0.2 |
King County employs Sea-Bird HydroCAT-EP (HC-EP) instruments for data collection at all marine mooring sites. Prior to 2017, YSI 6600 V2 multi-parameter data sondes were used. Both of these sensors measure water temperature, conductivity (salinity), pressure (depth), dissolved oxygen, turbidity (at some sites), pH (at some sites), and fluorescence (chlorophyll).
The YSI 6600 V2 datasonde consists of a cylindrical, pressure-resistant body with a cable connection at one end and an array of external sensors on the opposite end. The Sea-Bird HC-EP has an internal flow path with an integral pump for some of the sensors, as well as an external optical sensor with a copper faceplate for chlorophyll and turbidity. Both types are configured to receive external power and communicate via SDI-12 to a datalogger.
In addition to the datasondes deployed at each site, several other sensors are deployed at specific sites. Additional sensors included:
- Satlantic SUNA (Submersible Ultraviolet Nitrate Analyzer) Sensor - the SUNA is a real-time, chemical-free optical sensor that calculates nitrite + nitrate concentrations based on ultraviolet absorption and from a calibration curve derived from water samples.
- Vaisala WXT510 meteorological station – the “met” stations record air temperature, relative humidity, wind speed and direction, rainfall, and photosynthetically active radiation (via Apogee Quantum Sensor). For wind data collection, fixed mooring sites (such as at a pier) use the Vaisala ultrasonic wind meter, while moving platforms such as the buoy use a mechanical wind sensor (RM Young wind monitor HD).
The sensors at each mooring are connected to WaterLOG Storm 3 data-logger, which is configured to collect measurements every 15 minutes. These data-logger and telemetry units collect and transmit real-time data via cellular modem to the marine moorings database.
Download Data
Use our online data visualization tools or download data.
Note: some data may be provisional. Contact MarineWQ@kingcounty.gov for information about the most recent quality control of data.
Documentation
Learn more about our program by reading relevant reports and presentations.
Contact us with any questions or access additional resources in the Science Section Library.