
 Translate
Greenhouse gas emissions data
Information about countywide sources of greenhouse gas emissions and partnership efforts to reduce these emissions in our region.
Greenhouse gases are the primary cause of recent climate change. To avoid the most serious impacts of climate change, we need major reductions in greenhouse gas emissions.
Measuring and understanding these emissions is important for our government operations and community at-large.
King County Greenhouse Gas Inventory Reports
New report underscores importance of implementing climate policies to reduce greenhouse gas emissions
Data shows per-capita greenhouse gas emissions in King County are on the decline, though total emissions are still on the rise. Existing state and federal policies and local action are critical to advance toward targets.
A new analysis finds that while greenhouse gas emissions per person have decreased 17% since 2007, total emissions continue to increase as King County's population grows. Total emissions rose 4% as compared to a 2007 baseline, though the population grew more than 25% since that time. Key drivers decreasing emissions included reduction in electricity and on-road vehicles emissions. Meanwhile, emissions from natural gas in industrial and commercial sectors, aviation, and industrial operations increased.
The report shows that while progress has been made, meaningfully reducing emissions is dependent on the successful implementation of existing federal, state, and local policies. Achieving reductions will require collective action of local governments, industries, businesses, and residents to cut emissions. Climate action will both contribute to global efforts to avoid the worst impacts of climate change, and provide direct benefits for local communities, such as improving air quality and reducing costs through energy efficiency.
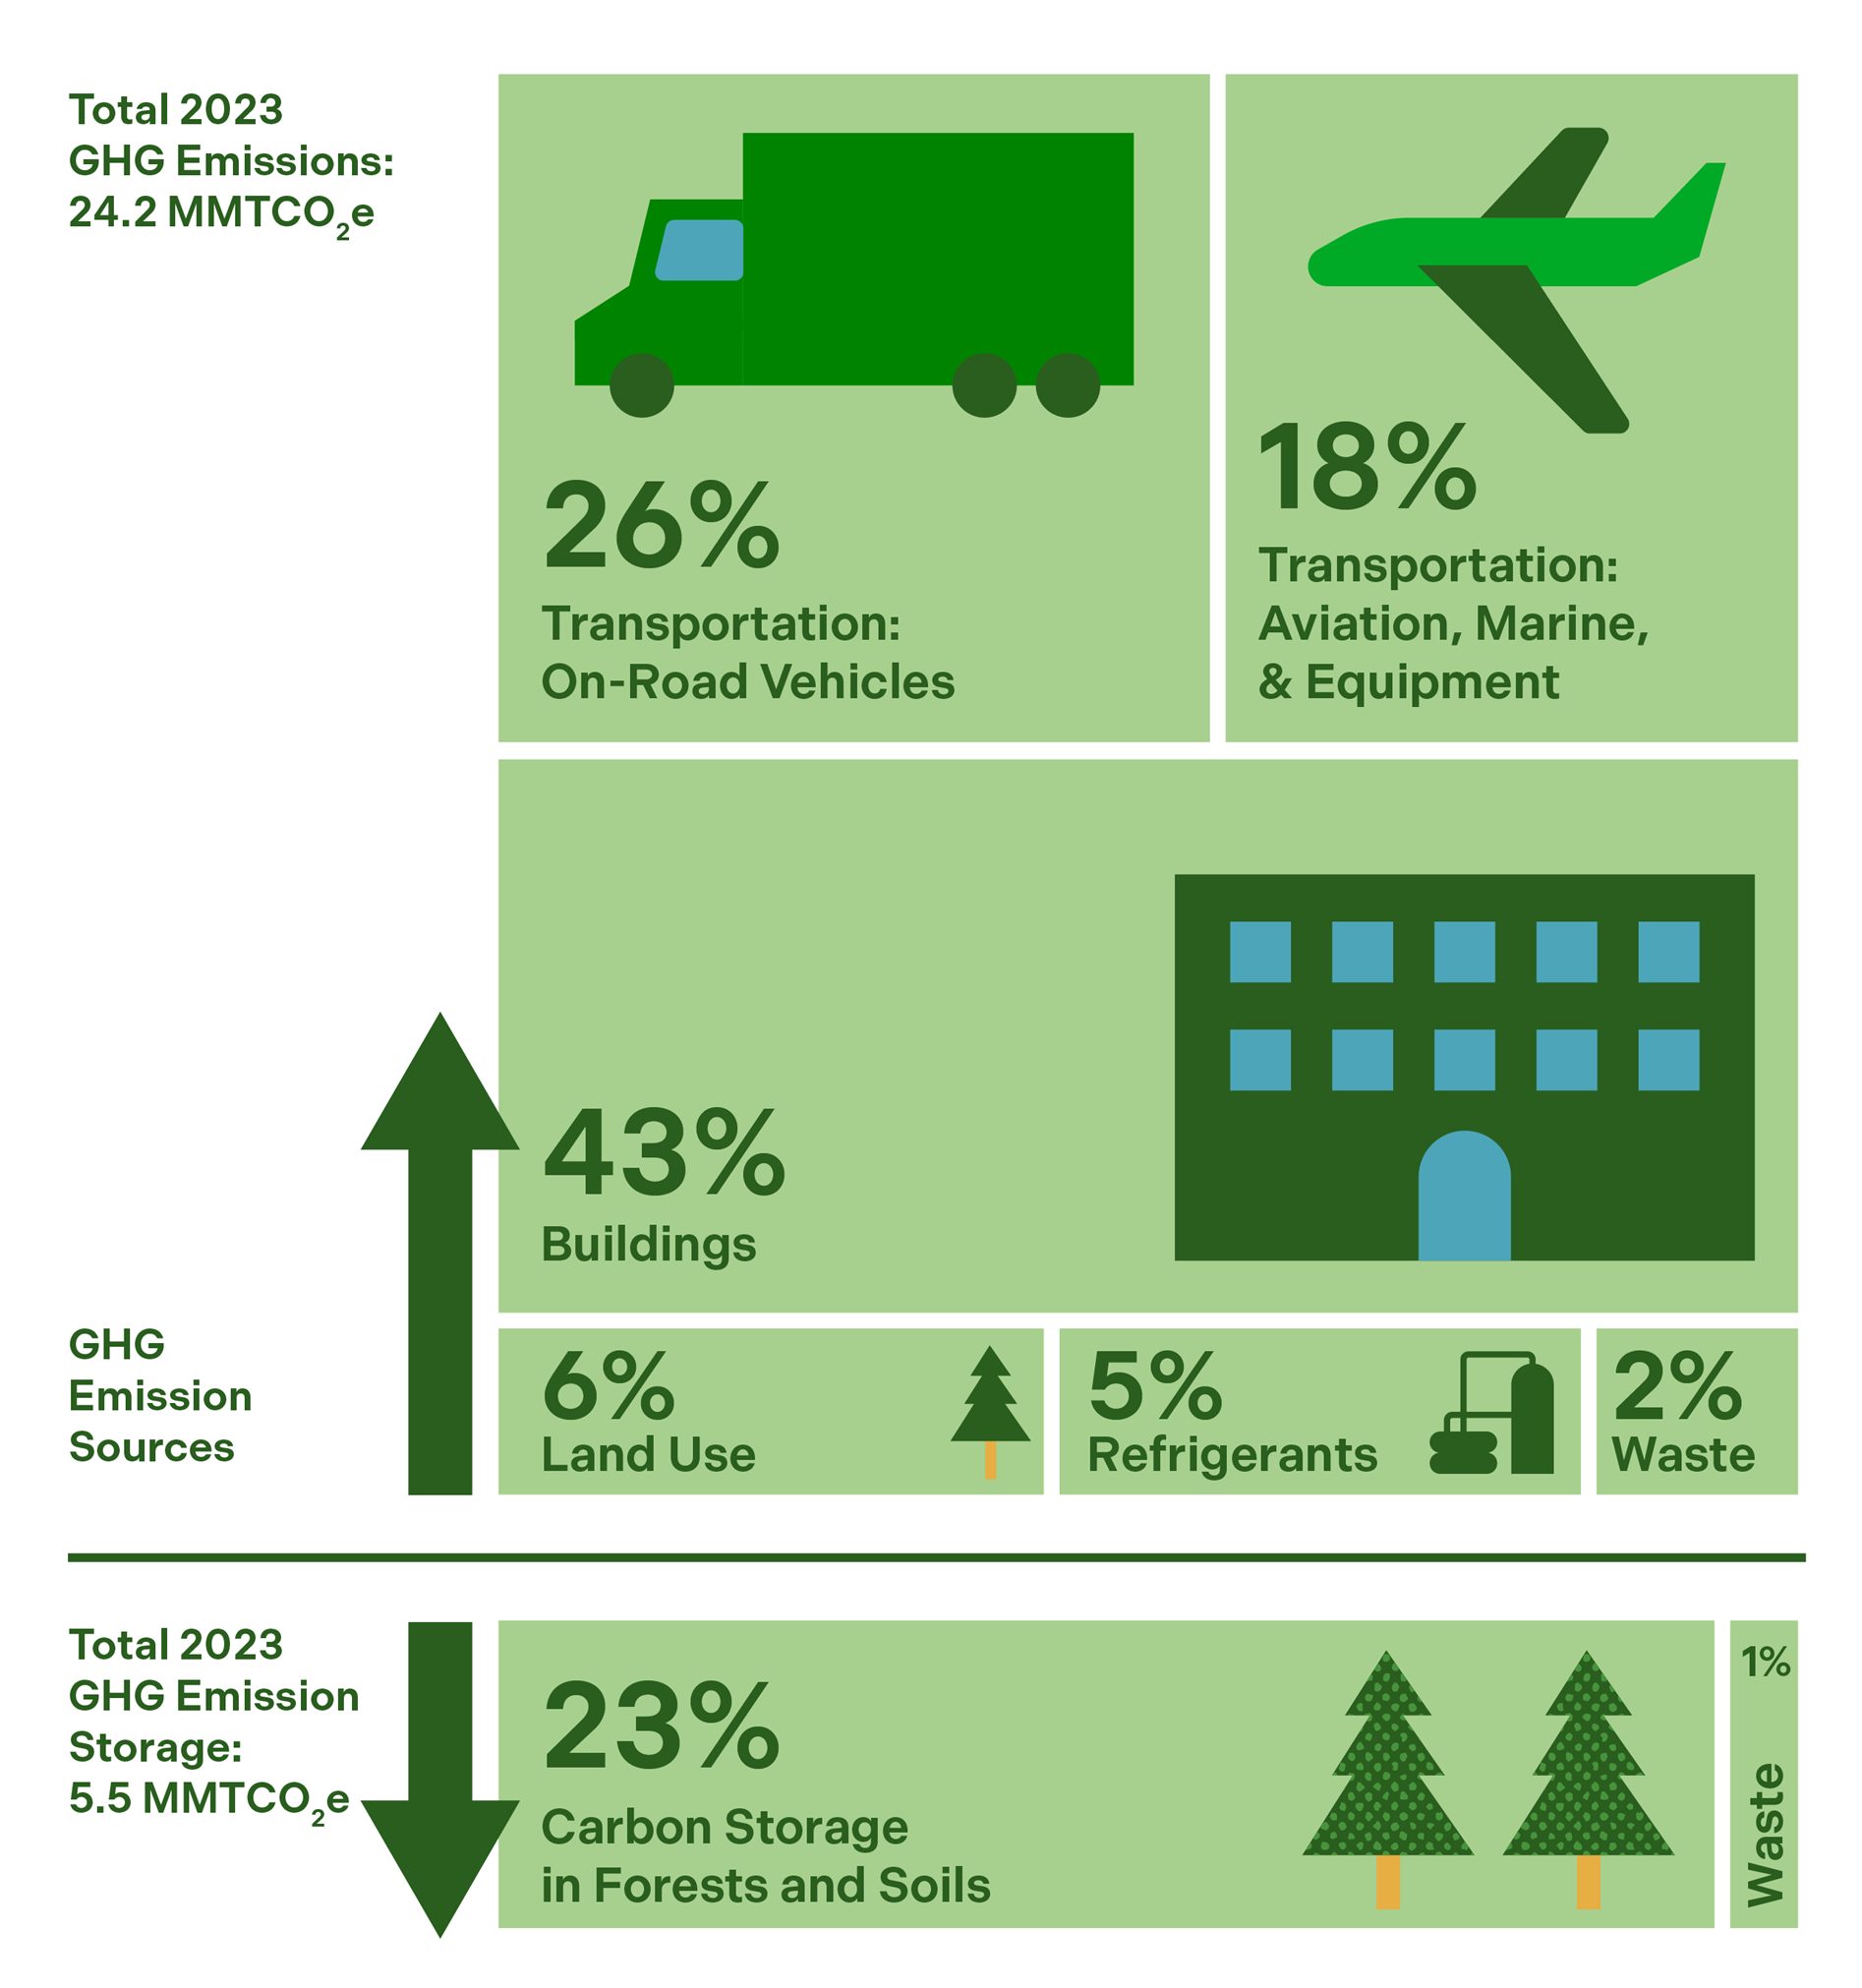
Sources of geographic emissions across King County:
In addition to the updated inventory report conducted by King County, new data tools also provide insight on emissions of individual cities in the region, offering information to help them as they plan and implement policies. The new datasets were commissioned by the King-County Cities Climate Collaboration (K4C), a coalition of local governments working together to accelerate climate action.
Greenhouse gas inventories help communities estimate sources and amounts of emissions generated by activities such as driving, energy use, and waste disposal. The new inventory, released by King County and prepared by Cascadia Consulting Group, focused on 2023 and updated data back through 2007. It found the following:
- In 2023, King County’s residents, businesses, employees, and visitors produced 24.2 million metric tons of CO2 equivalent (MTCO2e). This equates to roughly 10.3 MTCO2e per capita in 2023.
- Per-capita GHG emissions have declined over time (-17% in 2023), compared to the 2007 baseline year.
- Total geographic emissions increased 4% as compared to 2007 and decreased 8% in recent years from 2019 to 2023.
- The largest GHG emissions sources in King County continue to be transportation (44%) and the built environment (43%).
- Transportation emissions, both on-road vehicle and aviation emissions, remain 5% below 2007 levels. However, results suggest travel patterns are rebounding to pre-pandemic levels. Improvements in vehicle efficiency and reductions in car trips per person contribute to the on-road vehicle emissions reductions observed.
- Built environment overall emissions have decreased 3% since 2019. Emissions from electricity have declined 23%, while natural gas emissions have increased by 25% over the same time period. Closure of Puget Sound Energy’s coal-fired power plants, Coalstrip Units 1 and 2, sharply reduced the emissions from electricity production even as overall usage has increased. Increases in natural gas emissions are driven primarily by commercial and industrial consumption, with residential usage increasing only slightly.
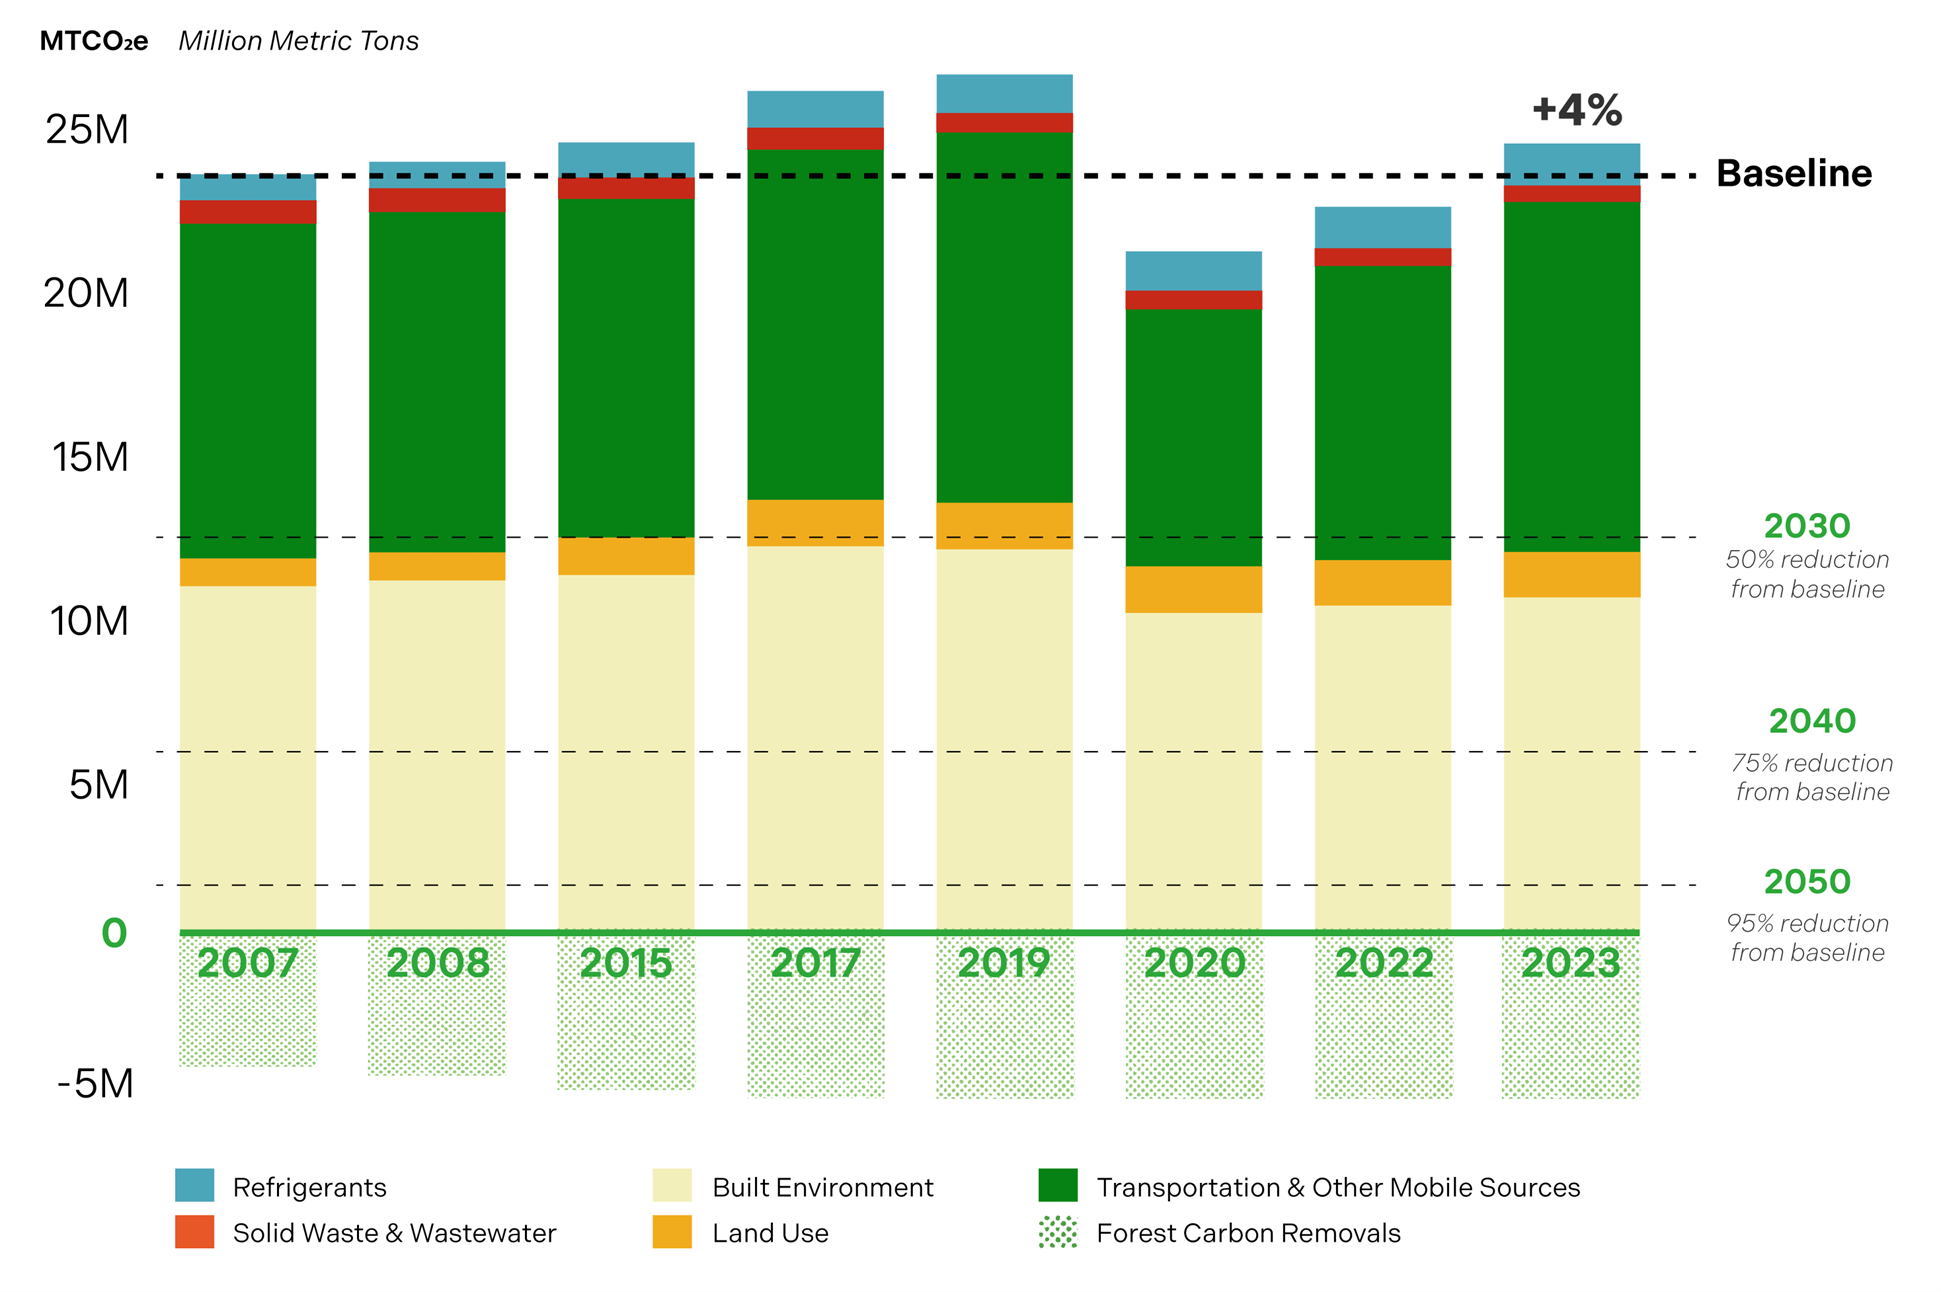
Total greenhouse gas emissions trends over time, by sector:
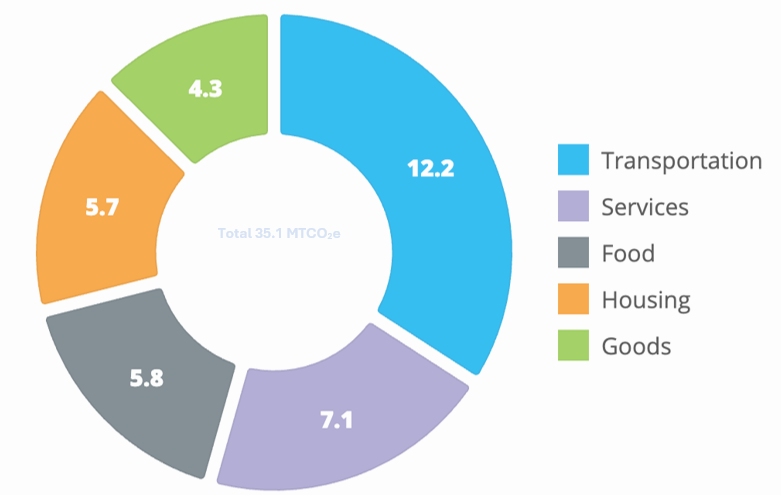
This report measured geographic emissions, which are emissions generated within the boundaries of King County by community activities. King County also developed a report on consumption-based emissions, which includes emissions from all goods and services consumed in the County by households, businesses, and governments. A few examples include food waste and construction materials . That report, prepared by EcoDataLab, found a 16% decrease in the average household’s emissions as compared to 2007, and that King County’s per-household emissions are lower than average in Washington state.
An average household’s breakdown of consumption-based emissions:
Looking forward
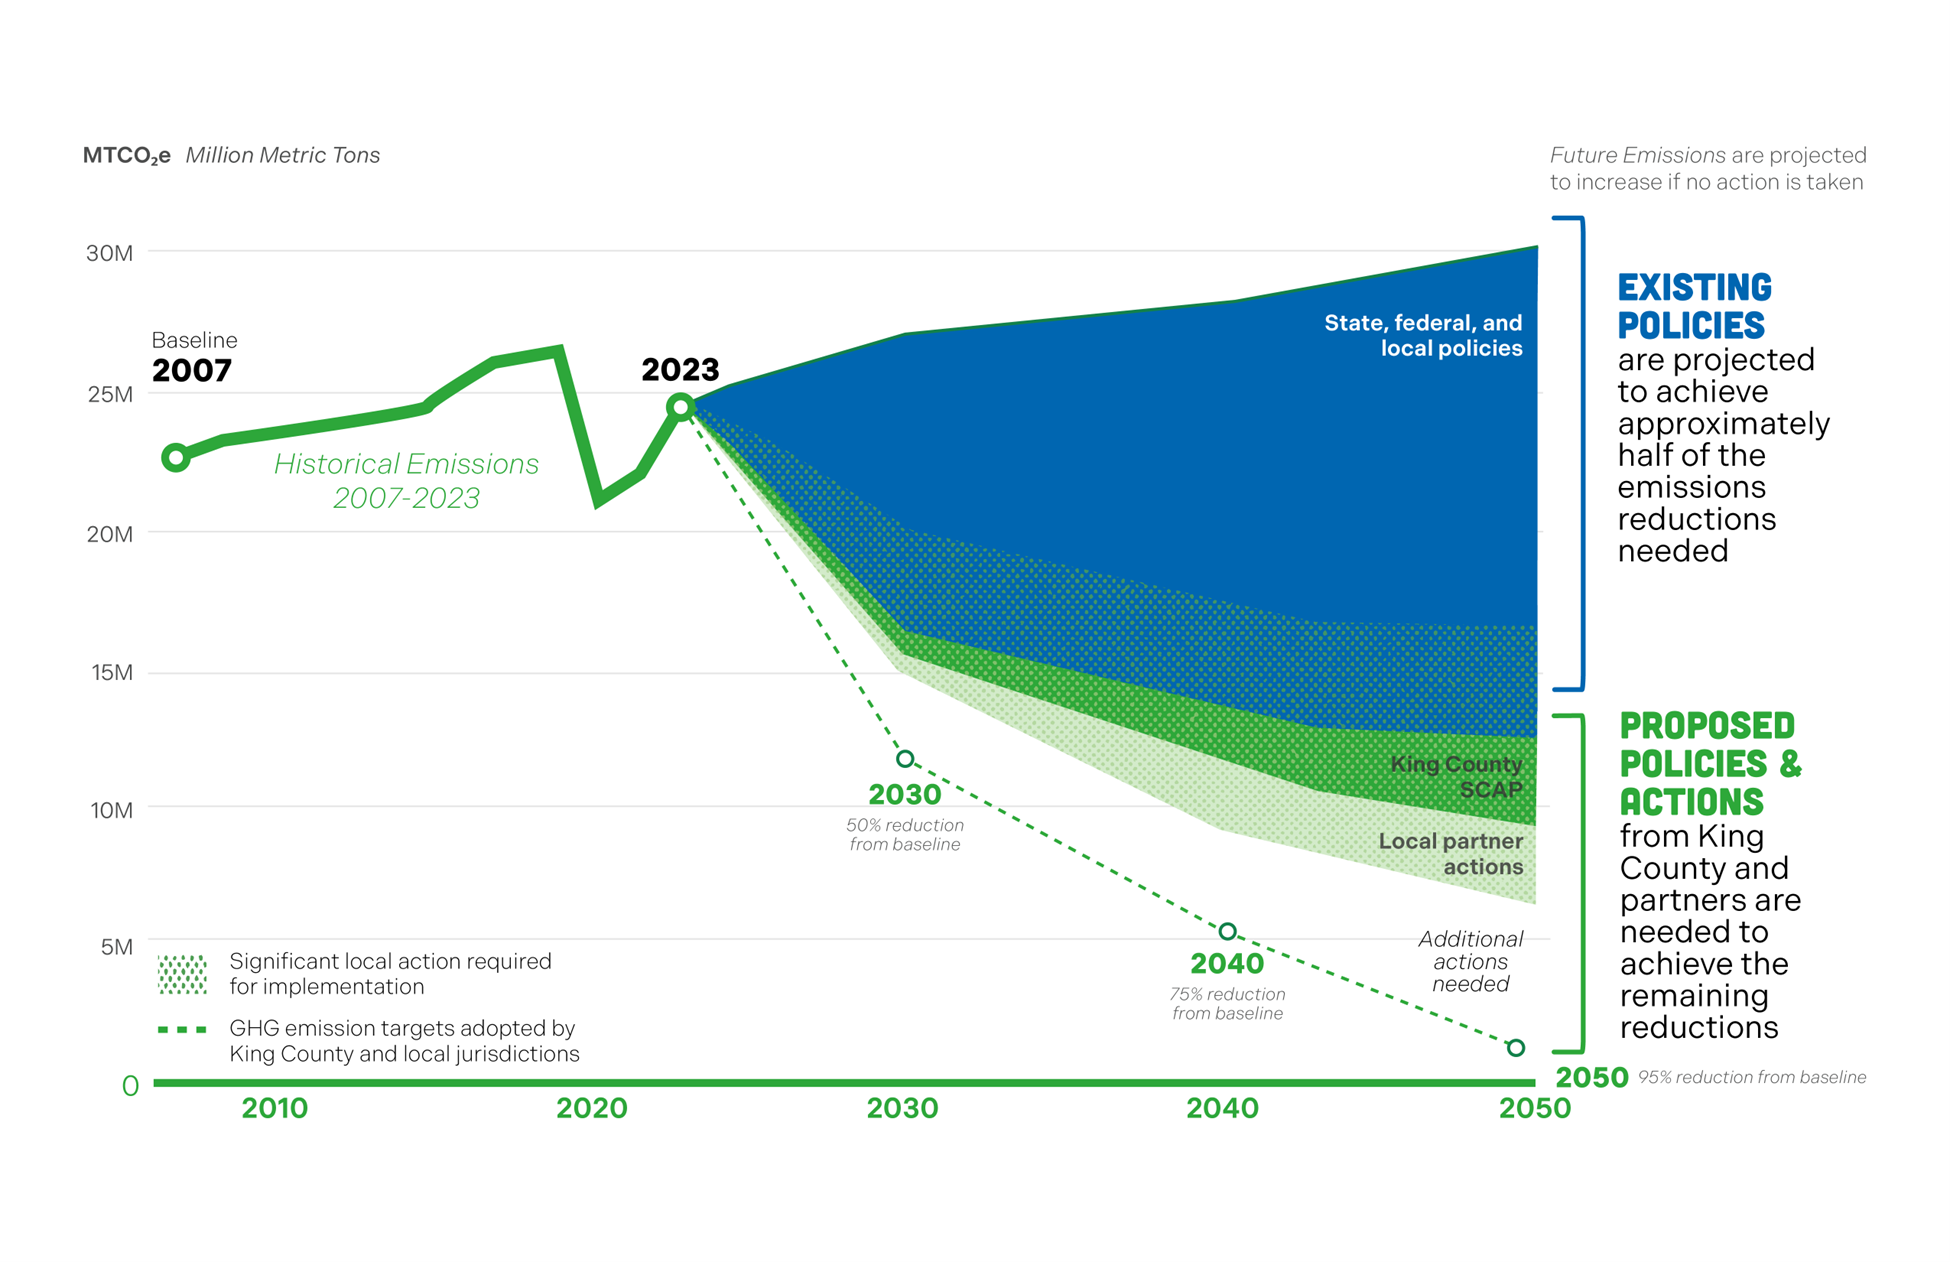
In 2022, as part of updates to King County Countywide Planning Policies, King County and cities in the region set shared targets to reduce emissions 50% below 2007 levels by 2030; 75% below 2007 levels by 2040; and 95% below 2007 levels and net carbon neutral by 2050. To that effect, the King County Communitywide Geographic Greenhouse Gas Emissions report also forecasts emissions and potential reductions by each of those dates, based on several potential scenarios.
The “wedge” graphic forecasts how specific existing and proposed 2025 SCAP measures can contribute to reduce emissions 33% by 2030 and 70% by 2050. Measures include state policies such the Clean Energy Transformation Act, federal policies such as the Federal Vehicle Standards, local policies such as the Seattle Building Emissions Performance Standard, and further actions proposed in the King County 2025 Strategic Climate Action to be implemented by governments, businesses, and local partners. Recent federal action is a critical threat to successful implementation of both federal and state policies. There remains an urgent need for collective action by local governments, industries, businesses, and residents to protect existing polices and take additional action to cut emissions.
Forecasted emission reductions from existing and proposed measures by sector:
While King County and partner cities only control some of these factors, the short and long-term impacts action can have is substantial. Each action contributes not just to putting less greenhouse gas emissions into the atmosphere, but also to improving air quality, public health, and the environment at home.
For King County government, outcomes are tracked and a new agenda is set through the Strategic Climate Action Plan, updated every five years. The 2025 Strategic Climate Action Plan has been adopted by the King County Council.
Puget Sound Regional Emissions Analysis Project
King County led the Puget Sound Regional Emissions Analysis Project, which was completed in 2022. The project provided comprehensive greenhouse gas emissions data. It also developed planning tools to advance local climate action for central Puget Sound cities and counties across King, Kitsap, Pierce, and Snohomish counties.
Project analysis shows that:
- Implementing new local, state, and federal energy policies will significantly reduce regional emissions over the coming years.
- The region is well positioned for unprecedented investments from the federal and state governments.
- There is an urgent need for collective action by local governments, industries, businesses, and residents.
- We must cut emissions faster to avoid the worst impacts of climate change and speed transition to an equitable, sustainable economy.
Geography and consumption-based inventories
There are two major ways to measure how much greenhouse gases our region is emitting.
- Geography-based inventories look at emissions within a community's boundaries due to local activities. This includes activities like transportation, powering and heating buildings, and local agriculture. A geographic emissions inventory does not account for upstream emissions from goods and services consumed within the community.
- Consumption-based inventories estimate greenhouse gas emissions associated with the activity of all residents of a specific area. It's like a personal household carbon footprint, but for all households. These inventories include upstream emissions for activities like food consumption and the production and transport of goods and services.
Our most recent communitywide reports provide data for both 2019 and 2020. However, because 2020 marked the beginning of the global COVID-19 pandemic, we're focused on data from 2019. In both geography- and consumption-based inventories.
Findings and reports
Previous reports and inventories
Data for 2007 – present should be cited from the most recent report. Previous reports available for reference only.
- 2022 Update: King County Communitywide Geographic Greenhouse Gas Emissions Report
- 2022 Update: King County Communitywide Consumption Greenhouse Gas Emissions Report
- 2017 Update: GHG Emissions in King County (893 KB)
- 2015 Update: GHG Emissions in King County (2.9 MB)
- 2010 Update: GHG Emissions in King County (143 KB)
- 2008 Update: GHG Emissions in King County (5.8 MB)
- 2003 Update: Inventory of King County Air Emissions (434 KB)
- 2000: Inventory of King County Air Emissions (3 MB)