Translate
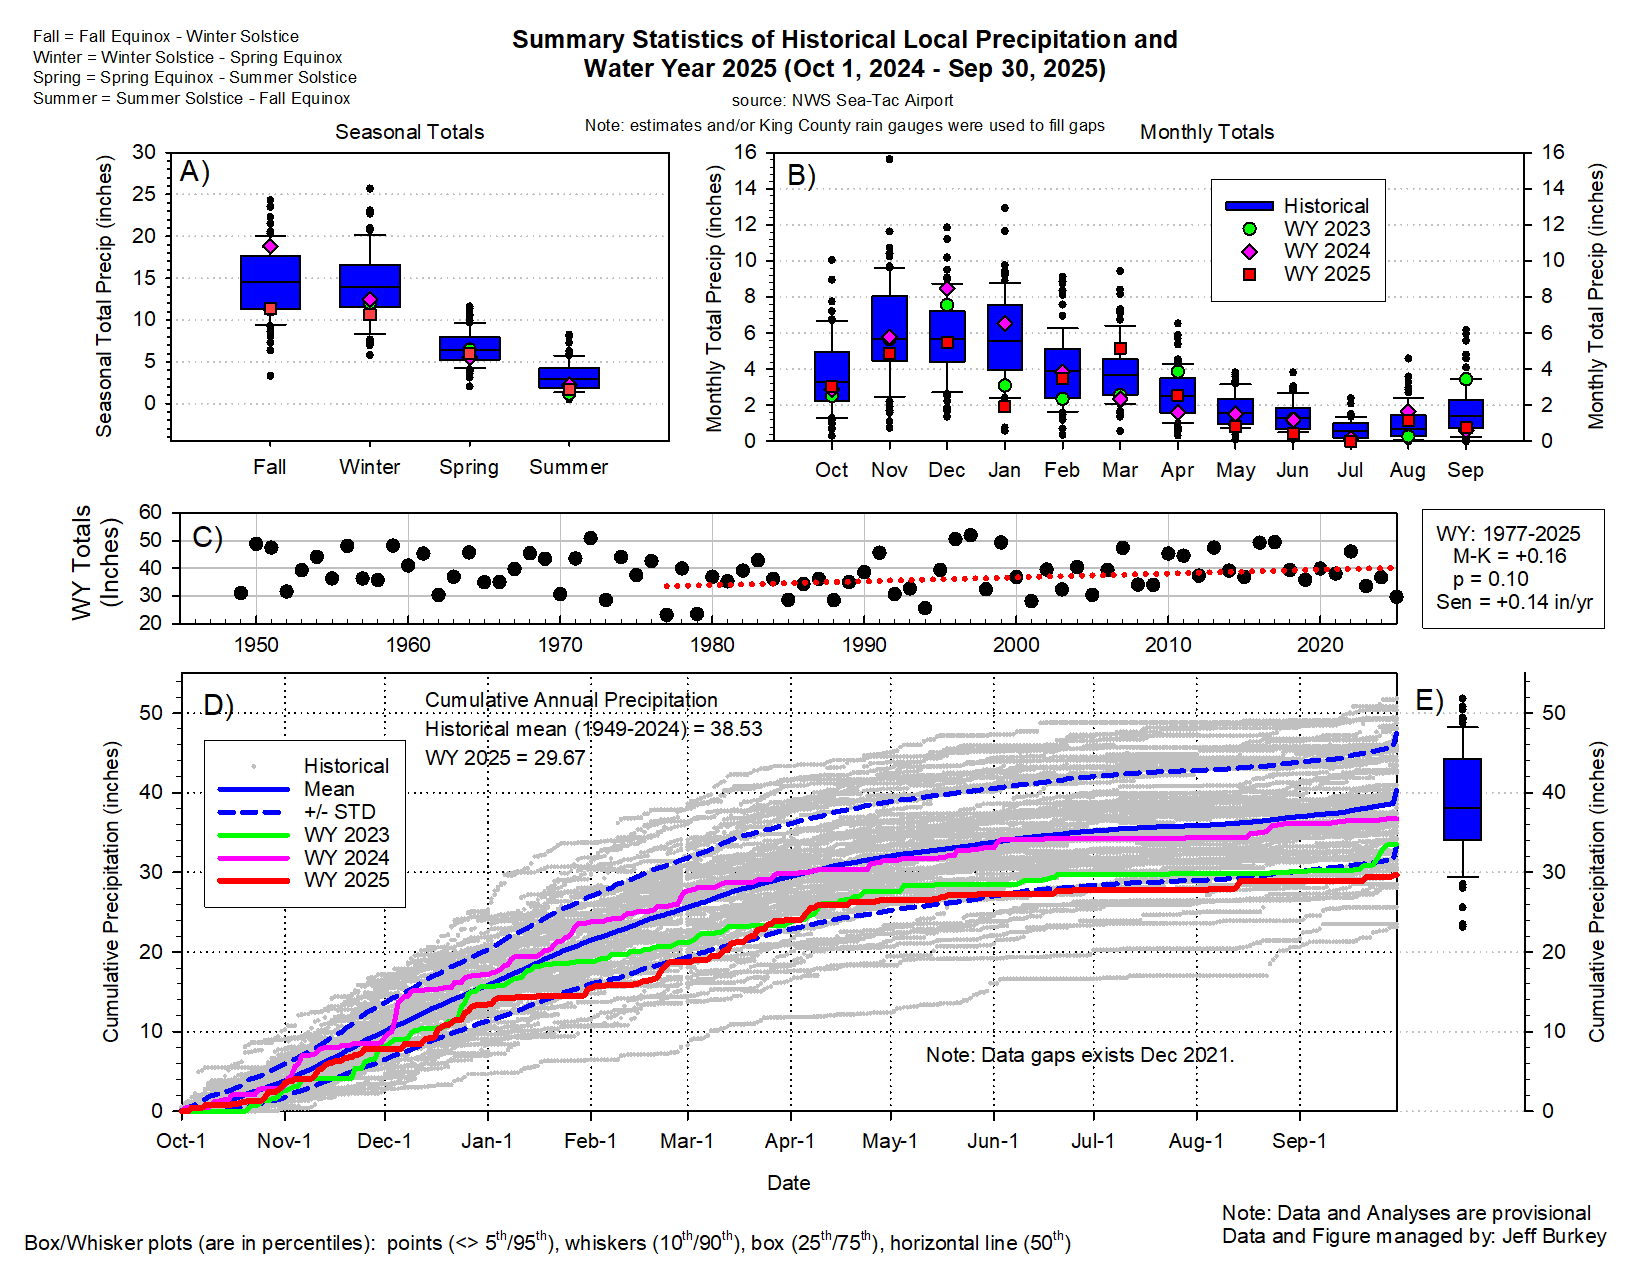
SeaTac Precipitation Data
A set of graphs showing the accumulated Sea-Tac precipitation beginning October 1, for the current water year.
In addition to current-year data, the graph shows the historical daily mean, and the standard deviations of the daily mean per calendar day for the water year (October 1 - September 30).
Data in this graph is retrieved and compiled from the he NOAA National Weather Service Report for Sea-Tac.
SeaTac Precipitation Data for Water Year 2025