911 Call Statistics
Want a closer look? Simply click on the image to select and magnify it for a better viewing experience.

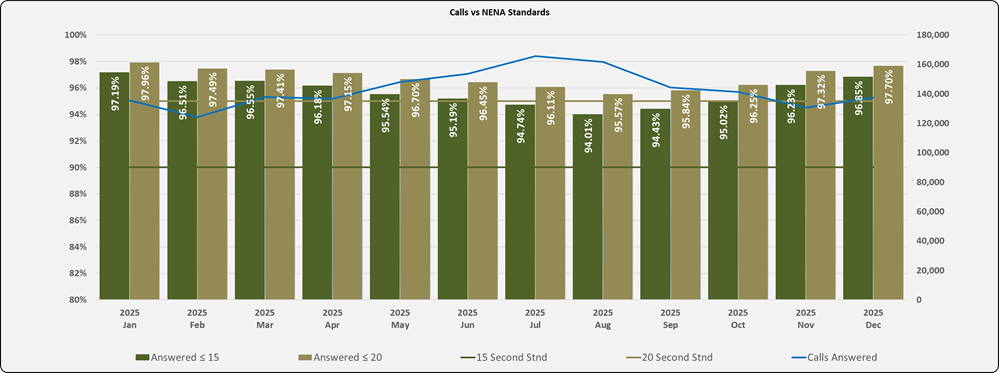
NENA standards mandate that ninety percent (90%) of 9-1-1 calls to the Public Safety Answering Point (PSAP) Shall be answered within fifteen (15) seconds or less. Ninety-five percent (95%) of all 9-1-1 calls Should be answered within twenty (20) seconds or less. These benchmarks ensure that emergency services provide timely assistance, potentially saving lives and improving public safety. Adherence to these standards allows PSAPs to operate efficiently and effectively.

The bar chart titled “Total 911 Emergency and Non-Emergency Calls in King County displays data from Jan 2025 to Dec 2025. It categorizes calls into Non-Emergency Calls, Wireless 911 Calls, VoIP 911 Calls, Wireline 911 Calls, and Text 911. The chart shows that the majority of calls are non-emergency and wireless 911 calls. Each month, the total number of calls is represented, with the y-axis indicating the volume of calls ranging from 0 to 400,000. This visualization provides insight into the distribution and patterns of emergency and non-emergency calls over several months in King County.

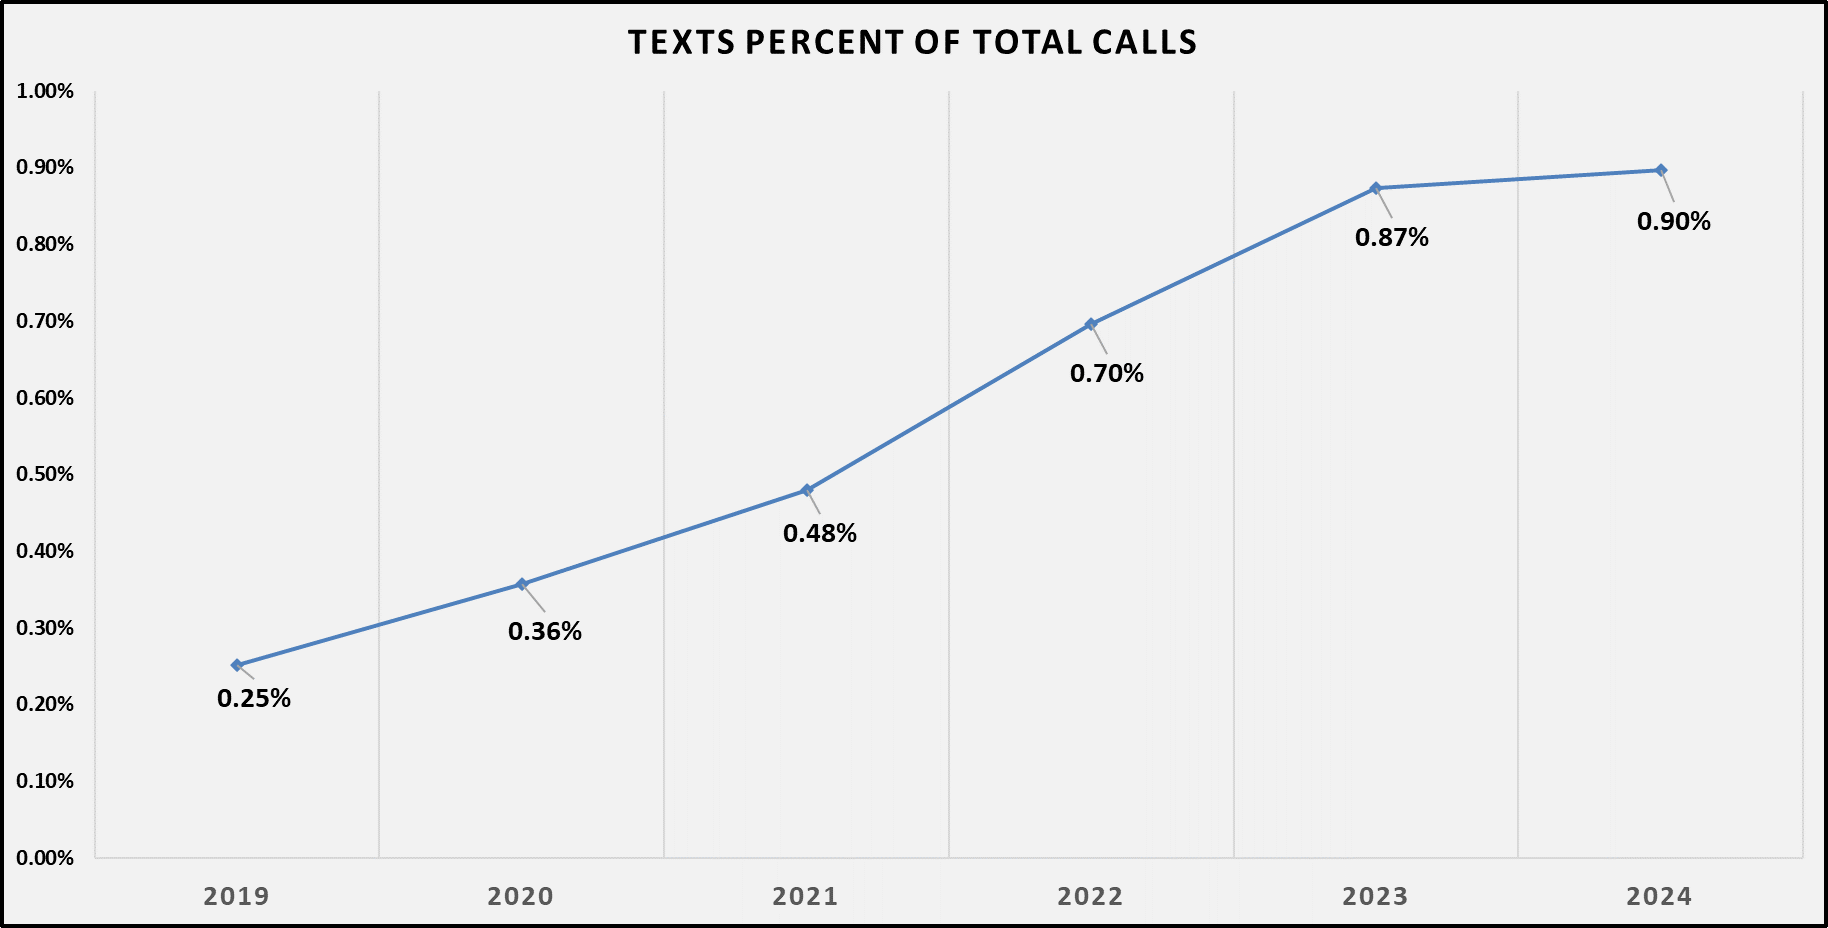
Over the past six years, there has been a significant increase in the percentage of texts compared to total calls. In 2019, texts represented 0.25% of all calls, rising to 0.35% in 2020. This upward trend continued with texts accounting for 0.47% in 2021 and increasing to 0.70% in 2022. By 2023, the share of texts had reached 0.87%. However, in 2024, there was a slight increase, with texts making up 0.90% of total calls. Overall trend highlights a growing dependence on texting as a communication method over the years.
 Translate