Information Management Systems
We manage specialized hardware and software that allow our field and lab scientists to access and interact with data and allow clients access to test results.
Our database: past, present, and future
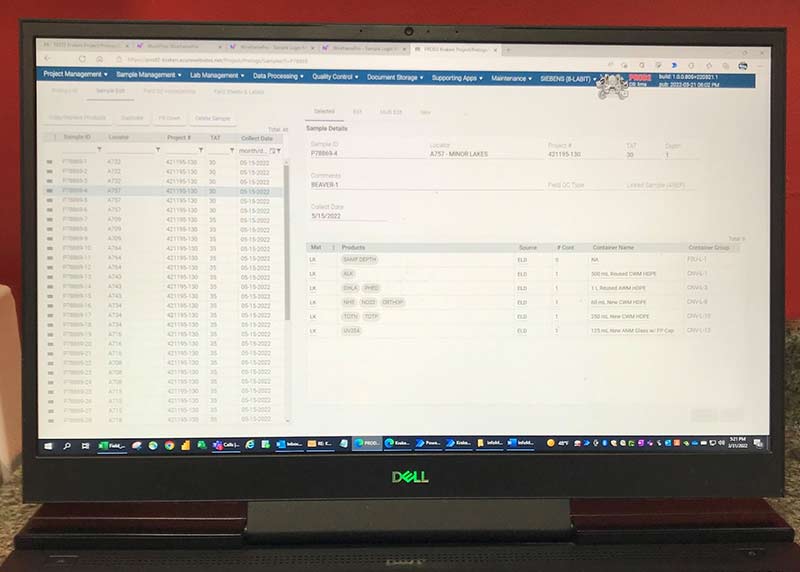
Beginning in 1965, Seattle Metro/King County started collecting and storing regional environmental data in a mainframe in Seattle. In the early 1990s, an application called the “Laboratory Information Management System” (LIMS) was brought on-line in our laboratory to allow our scientists to plan, track, analyze, report, and store data generated at our laboratory. It also became the home of this ever-growing regional data set. This database provides a rich data set for looking at historical water quality trends and is widely used by our clients.
Currently, our database is undergoing a major modernization. This update will replace the desktop application model with a webpage-based interface. These improvements will allow our scientists to generate, analyze, report, and store critical environmental data more efficiently. It will also make our data more transparent and useful for our clients.
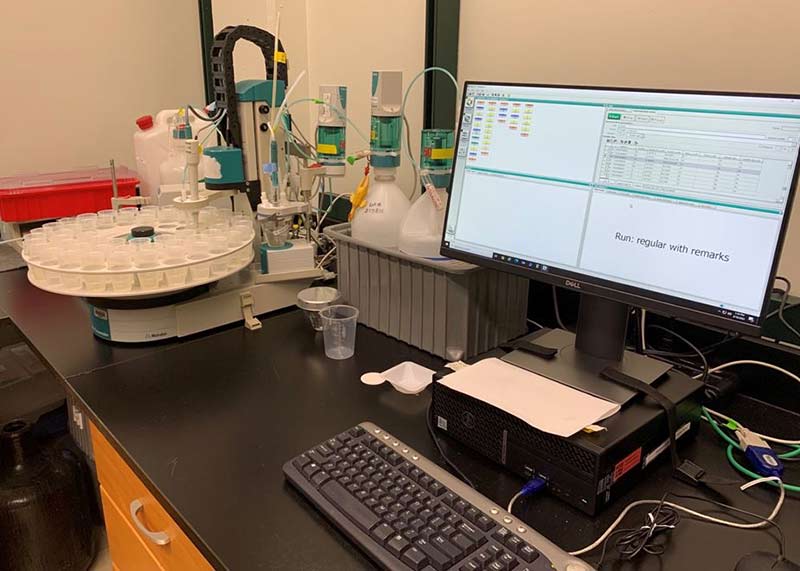
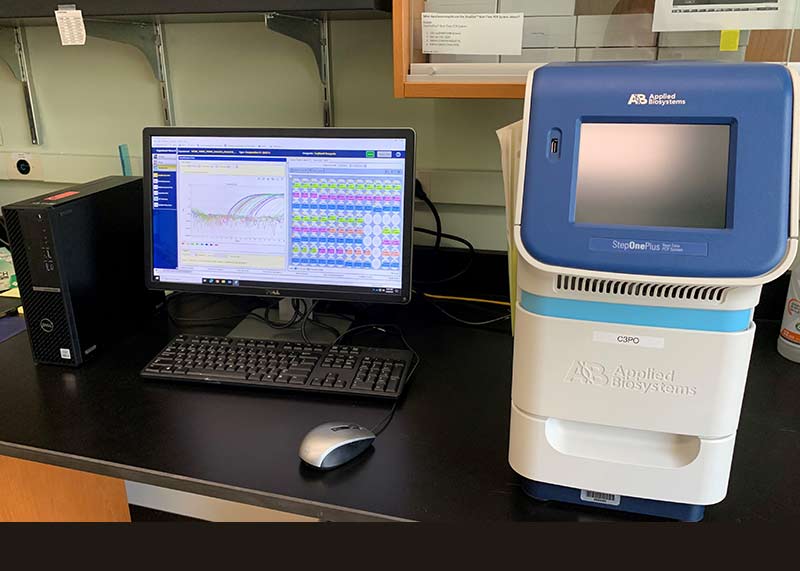
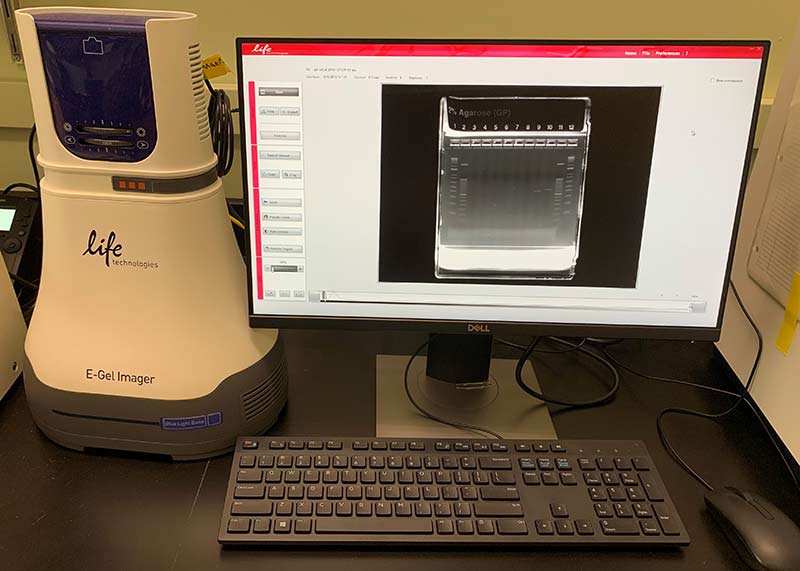
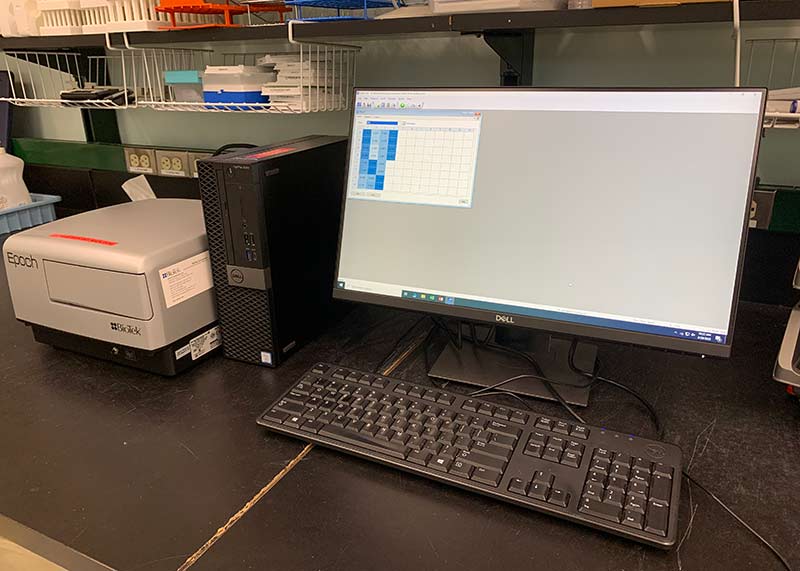
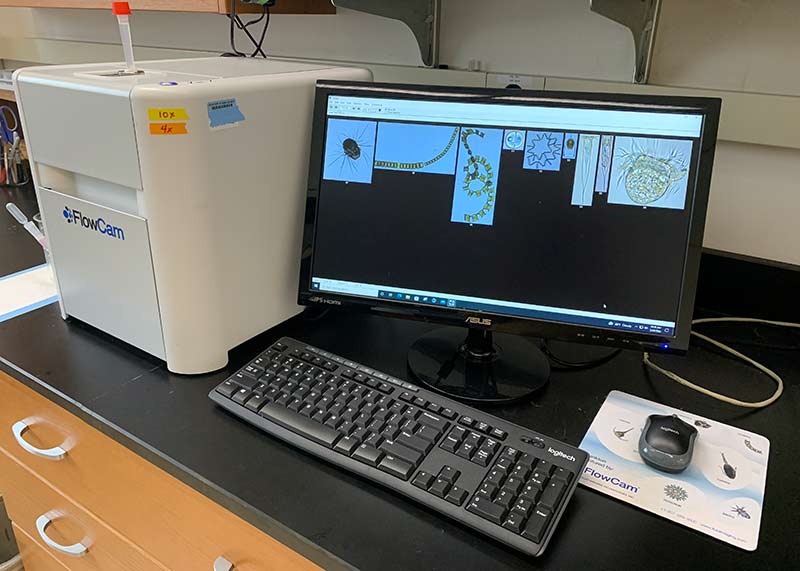
Specialized Laboratory Hardware and Software
There are a variety of specialized software and hardware to maintain and support a variety of our specialized instrument and scientific software and hardware essential to the laboratory.
These systems are used to report biological, chemical, physical, quality assurance data, and other data formats. Each type of data requires different analysis and organization. We are always working to ensure all the data generated by our laboratory is appropriately handled and stored.
 Translate